अब से हम Elev8 हैं
हम केवल एक ब्रोकर नहीं हैं। हम एक ऑल-इन-वन ट्रेडिंग इकोसिस्टम हैं—आपको विश्लेषण करने, ट्रेड करने और बढ़ने के लिए जो कुछ भी चाहिए, वह एक ही स्थान पर है। क्या आप अपने ट्रेडिंग को ऊँचा उठाने के लिए तैयार हैं?
हम केवल एक ब्रोकर नहीं हैं। हम एक ऑल-इन-वन ट्रेडिंग इकोसिस्टम हैं—आपको विश्लेषण करने, ट्रेड करने और बढ़ने के लिए जो कुछ भी चाहिए, वह एक ही स्थान पर है। क्या आप अपने ट्रेडिंग को ऊँचा उठाने के लिए तैयार हैं?
USD/CHF takes the bids to 0.9835 amid the pre-European session on Wednesday. In doing so, the pair crosses 38.2% Fibonacci retracement of its broad run-up between February 2018 and April 2019. Also supporting the pair’s upside is a first in nine weeks bullish MACD signal.
Based on that, buyers are again targeting a 200-week SMA level of 0.9850 whereas a descending trend line from April 2019, at 0.9940 can question the bulls afterward.
In a case where the USD/CHF prices stay strong beyond 0.9940, chances of witnessing the 1.0000 mark on the chart can’t be ruled out.
Alternatively, 0.9770/65 and 50% Fibonacci retracement level around 0.9710 can entertain sellers during the pullback ahead of pleasing them with the yearly bottom of 0.9612.
However, 61.8% Fibonacci retracement and September 2018 trough near 0.9585 and 0.9540 respectively could challenge the bears during the further declines.
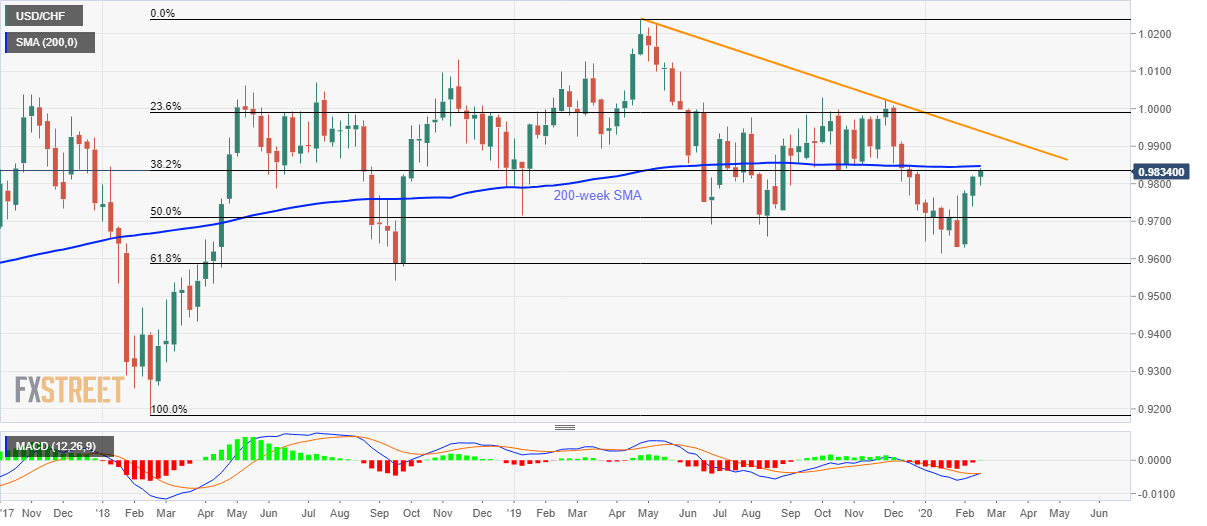
Trend: Bullish