Mulai sekarang kamiialah Elev8
Kami lebih daripada sekadar broker. Kami adalah ekosistem dagangan serba ada—semua yang anda perlukan untuk menganalisis, berdagang, dan berkembang ada di satu tempat. Sedia untuk tingkatkan dagangan anda?
Kami lebih daripada sekadar broker. Kami adalah ekosistem dagangan serba ada—semua yang anda perlukan untuk menganalisis, berdagang, dan berkembang ada di satu tempat. Sedia untuk tingkatkan dagangan anda?
USD/INR registers minor gains of around 0.13% while taking the bids to 71.43 amid the initial Indian session on Tuesday. The pair portrays a bearish technical pattern on the daily chart.
With the pair’s repeated failures to take-out 38.2% Fibonacci retracement of its December 11, 2019, to January 08, 2020 upside, odds are high for its gradual declines to 71.22/20 support confluence including 100-day EMA and the bearish formation’ support.
However, the pair’s declines below 71.20 on a daily closing basis will trigger a fresh downside to the yearly bottom surrounding 70.60 and then to December month lows near 70.30.
Meanwhile, an upside clearance of 38.2% Fibonacci retracement, at 71.70, could push the pair towards the 72.00 resistance confluence including the pattern’s resistance and 23.6% Fibonacci retracement.
It’s worth mentioning that the pair’s ability to cross 72.00 defies the downside favoring pattern and will push the quote towards January month top close to 72.60.
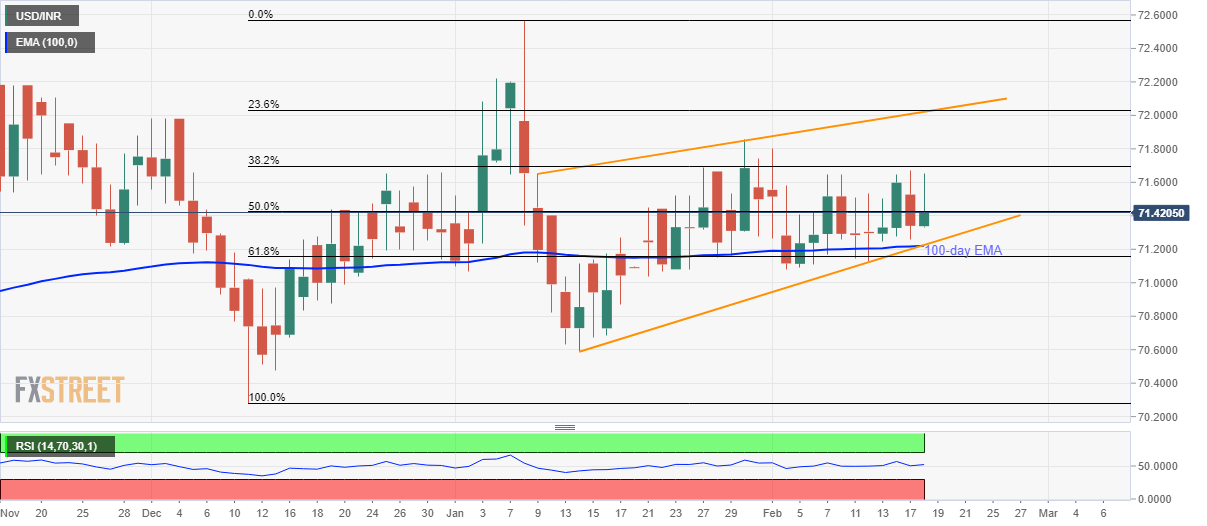
Trend: Pullback expected