এখন থেকে আমরা Elev8
আমরা শুধুমাত্র একটি ব্রোকার নই। আমরা একটি সর্বাত্মক ট্রেডিং ইকোসিস্টেম—বিশ্লেষণ, ট্রেড, এবং প্রবৃদ্ধির জন্য আপনার যা কিছু প্রয়োজন তা এক জায়গায়। আপনার ট্রেডিং উন্নত করতে প্রস্তুত?
আমরা শুধুমাত্র একটি ব্রোকার নই। আমরা একটি সর্বাত্মক ট্রেডিং ইকোসিস্টেম—বিশ্লেষণ, ট্রেড, এবং প্রবৃদ্ধির জন্য আপনার যা কিছু প্রয়োজন তা এক জায়গায়। আপনার ট্রেডিং উন্নত করতে প্রস্তুত?
AUD/JPY stays mildly positive while taking rounds to 73.35 during the early hours of Tuesday’s Asian session. The pair recently managed to reverse from 61.8% Fibonacci retracement of its January 02-06 upside. However, bearish MACD signals and multiple upside barriers will check the pair’s recovery.
Among the resistances, 50% Fibonacci retracement level of 73.40 and a descending trend line from February 06, at 73.45, will be the immediate ones to watch.
Apart from 73.45, a confluence of 200-hour EMA and 38.2% Fibonacci retracement around 73.65/70 will also challenge the buyers.
In a case where AUD/JPY prices stay positive beyond 73.70, 74.00 and the monthly top surrounding 74.40 will be in the spotlight.
On the downside break of 61.8% Fibonacci retracement, at 73.15, the quote can take rest around 73.00 before revisiting 72.80 and the last week’s bottom close to 72.40.
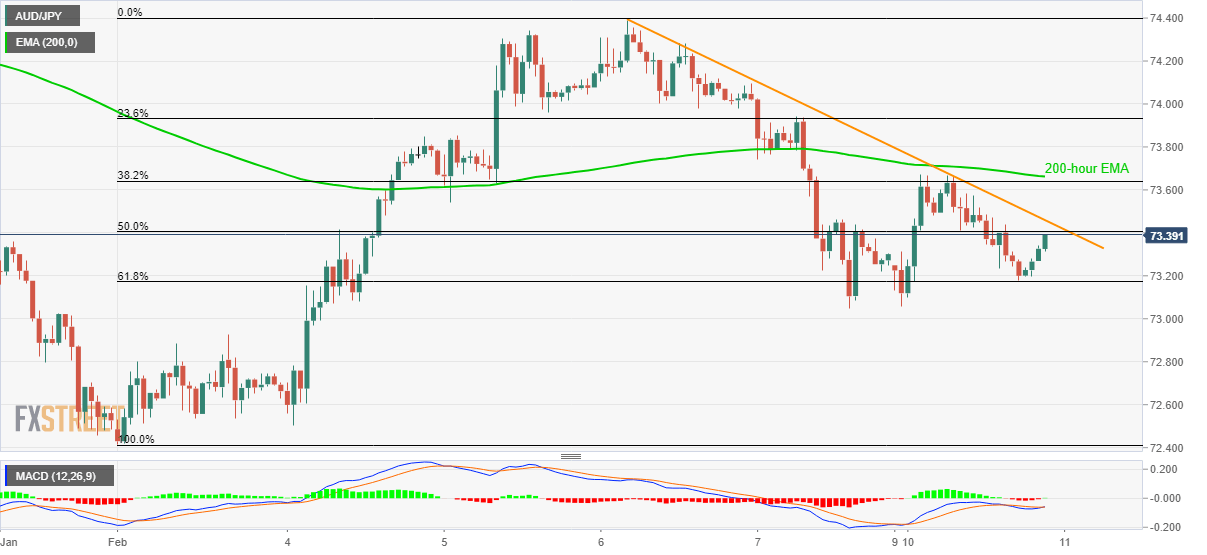
Trend: Bearish