अब से हम Elev8 हैं
हम केवल एक ब्रोकर नहीं हैं। हम एक ऑल-इन-वन ट्रेडिंग इकोसिस्टम हैं—आपको विश्लेषण करने, ट्रेड करने और बढ़ने के लिए जो कुछ भी चाहिए, वह एक ही स्थान पर है। क्या आप अपने ट्रेडिंग को ऊँचा उठाने के लिए तैयार हैं?
हम केवल एक ब्रोकर नहीं हैं। हम एक ऑल-इन-वन ट्रेडिंग इकोसिस्टम हैं—आपको विश्लेषण करने, ट्रेड करने और बढ़ने के लिए जो कुछ भी चाहिए, वह एक ही स्थान पर है। क्या आप अपने ट्रेडिंग को ऊँचा उठाने के लिए तैयार हैं?
GBP/JPY trades modestly changed to 143.35 during Monday’s Asian session. That said, the pair holds its break of the short-term ascending triangle formation, which in-turn signals further declines.
In doing so, 23.6% Fibonacci retracement, around 142.50 will be the key to watch as the immediate support.
Should sellers keep the reins past-142.50, 141.00 and the monthly bottom near 140.80 will offer intermediate halts to the pair’s drop towards 140.00 round-figure.
If at all prices bounce back beyond the formation support, at 143.45 now, buyers will need to justify their strength by cross 144.35/55 area including 50% Fibonacci retracement and highs marked since late-December 17.
Following the quote’s sustained run-up above 144.55, 61.8% Fibonacci retracement near 145.25 will return to the chart.
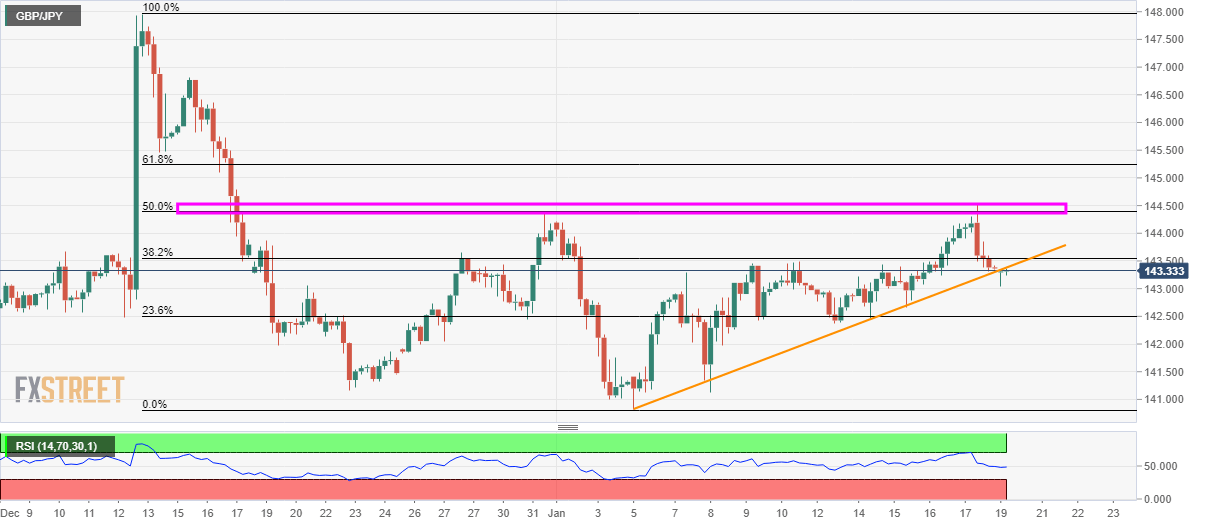
Trend: Bearish