Kể từ bây giờ chúng tôi là Elev8
Chúng tôi không chỉ là một nhà môi giới. Chúng tôi là một hệ sinh thái giao dịch tất cả trong một—mọi thứ bạn cần để phân tích, giao dịch và phát triển đều có ở một nơi. Sẵn sàng nâng tầm giao dịch của bạn?
Chúng tôi không chỉ là một nhà môi giới. Chúng tôi là một hệ sinh thái giao dịch tất cả trong một—mọi thứ bạn cần để phân tích, giao dịch và phát triển đều có ở một nơi. Sẵn sàng nâng tầm giao dịch của bạn?
The US Dollar losses some ground against the Japanese Yen on Monday amid a bank holiday in Japan as the USD/JPY shrugged off a rise in the US 10-year T-note yield. At the time of writing, the pair trades at 157.54, down by 0.11%.
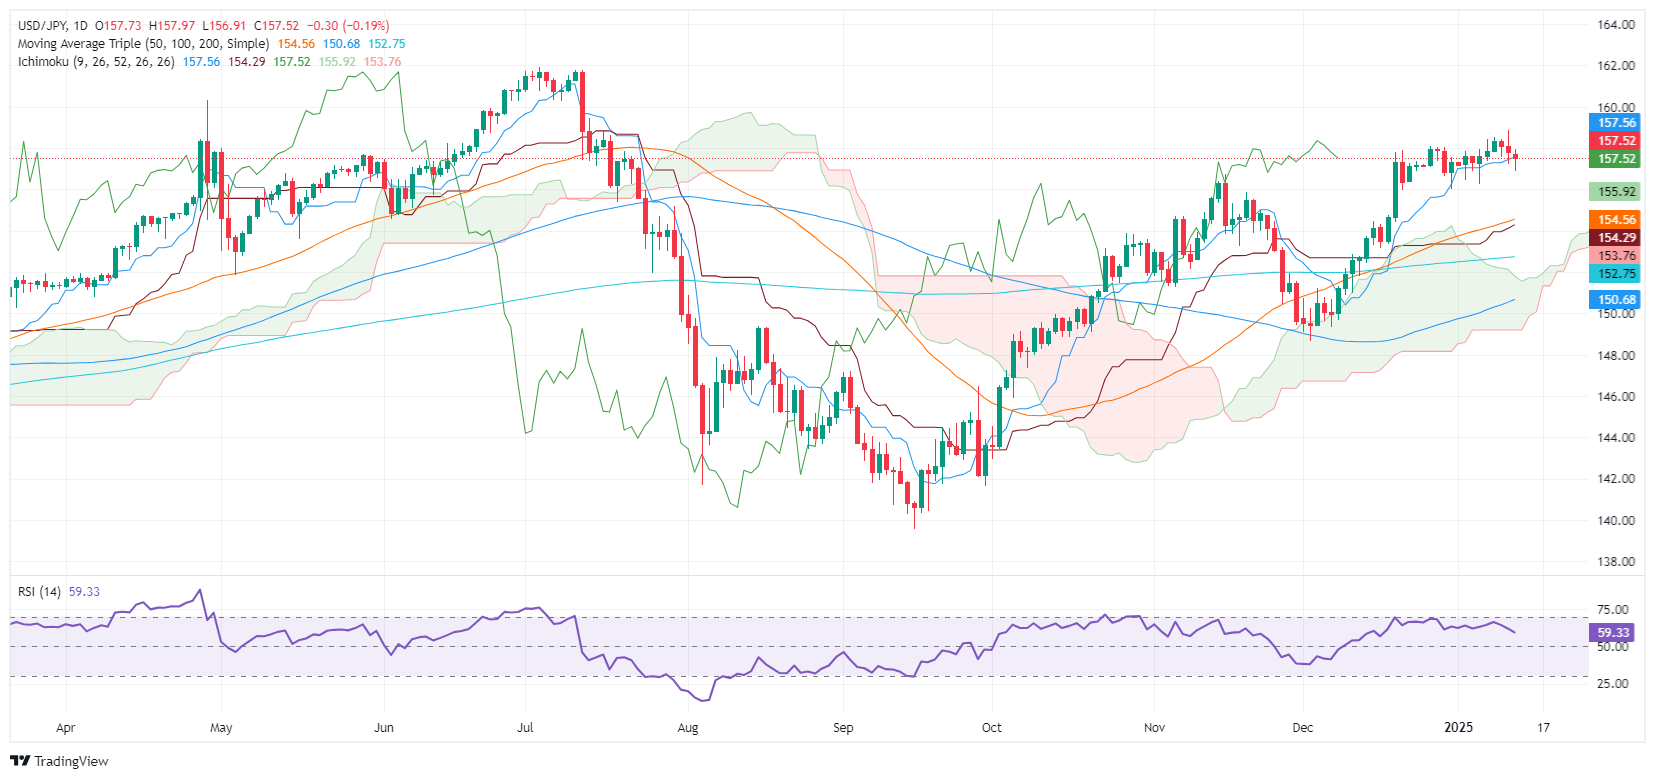
The USD/JPY daily chart remains upward biased, but faces strong resistance at 158.00, amid fears that the Bank of Japan (BoJ) might intervene in the Forex markets. Momentum favors further upside, after the 50-day Simple Moving Average (SMA) at 154.58 crossed above the 200-day SMA, forming a 'golden cross,' implying that further upside is seen.
For a bullish continuation, the USD/JPY first ceiling level would be the 158.00 figure followed by the January 10 peak hit following US NFP data on Friday at 158.88. A breach of the latter will expose 159.00.
If USD/JPY tumbles below Tenkan-sen, the next support would be the January 6 low of 156.24, followed by the December 31 pivot low of 156.02.
The table below shows the percentage change of Japanese Yen (JPY) against listed major currencies today. Japanese Yen was the strongest against the US Dollar.
| USD | EUR | GBP | JPY | CAD | AUD | NZD | CHF | |
|---|---|---|---|---|---|---|---|---|
| USD | -0.25% | -0.20% | -0.11% | -0.13% | -0.23% | -0.31% | -0.16% | |
| EUR | 0.25% | 0.07% | 0.11% | 0.13% | 0.02% | -0.06% | 0.13% | |
| GBP | 0.20% | -0.07% | 0.10% | 0.07% | -0.04% | -0.13% | 0.04% | |
| JPY | 0.11% | -0.11% | -0.10% | 0.06% | -0.15% | -0.22% | -0.04% | |
| CAD | 0.13% | -0.13% | -0.07% | -0.06% | -0.14% | -0.17% | 0.01% | |
| AUD | 0.23% | -0.02% | 0.04% | 0.15% | 0.14% | -0.08% | 0.08% | |
| NZD | 0.31% | 0.06% | 0.13% | 0.22% | 0.17% | 0.08% | 0.17% | |
| CHF | 0.16% | -0.13% | -0.04% | 0.04% | -0.01% | -0.08% | -0.17% |
The heat map shows percentage changes of major currencies against each other. The base currency is picked from the left column, while the quote currency is picked from the top row. For example, if you pick the Japanese Yen from the left column and move along the horizontal line to the US Dollar, the percentage change displayed in the box will represent JPY (base)/USD (quote).